After Saudi foreign minister Adel al-Jubeir’s comment “If other producers want to limit or agree to a freeze in terms of additional production that may have an impact on the market but Saudi Arabia is not prepared to cut production” sank oil prices…
33.01
▼ 1.27 (3.7%) BRENT USD/bbl
29.64
▼ 1.13 (3.7%) WTI USD/bbl
16.89
▼ 1.23 (6.8%) WCS USD/bbl
23.26
▼ 1.66 (6.7%) WCS CAD/bbl
DAILY CHANGE FEB 19, 2016
…the assertions of Vox’s Matthew Yglesias have already come to fruition:
Saudi Arabia and Russia, the world’s two largest oil producers, joined Qatar and Venezuela at a big OPEC meeting to announce a plan to cap oil production and bring a halt to the slide in crude oil prices that’s rocked global markets over the past couple of years.
But don’t expect it to work.
The key problem is that even though Saudi Arabia and Russia are huge producers of crude oil, they haven’t been responsible for much of the recent increase in oil supply. So capping production at January levels, which is what they are talking about, won’t necessarily do much to prevent new supply from coming online.
Mr. Yglesias correctly identifies the country that is inciting the glut:
The USA is the sleeping giant of oil production
Last but by no means least, the United States — the world’s No. 3 producer of oil — isn’t party to any such deal and doesn’t even attend these kinds of meetings, because we are net importers of crude oil.
American production is down a bit from its highs in the summer of 2015. But that’s not a policy decision to cut production, it’s not security problems, and it’s not a lack of exploitable oil resources. What’s stymied US production is that the price of oil fell steeply enough that the pace of new drilling collapsed.
That’s been the one ray of good news for Persian Gulf oil producers in 2016. But it also in effect puts a cap on oil prices. Even if the Saudis and the Russians could get Iran and Iraq on board for production cuts to raise prices, if prices rise too much, US production will come roaring back.
Or American oil rig counts will take over and begin controlling the price of Brent and WTI directly:
Crude-oil prices edged up in early trade Monday morning but oversupply and slowing demand growth continue to weigh on market sentiment.
On the New York Mercantile Exchange, light, sweet crude futures for delivery in March CLH6, +3.24% traded at $30.57 a barrel, up $0.92, or 2.9%, in the Globex electronic session. April crude CLJ6, +3.31% rose 82, or 2.4%, to $32.67 a barrel.
April Brent crude LCOJ6, +2.91% on London’s ICE Futures exchange rose $0.83, or 2.5%, to $33.84 a barrel.
Prices mainly advanced after industry group Baker Hughes reported the U.S. oil rig number fell by 26 to 413, marking the ninth straight week of decline.
Goldman Sachs said the current rig count implied U.S. production declining by 395,000 barrels a day between the last quarter of 2015 to the end of this year.
“Annual average US production would decrease by 445,000 barrels a day year-on-year on average in 2016, down an additional 20,000 barrels a day compared to the prior week estimate,” said the bank in a note.
The decline in oil rigs is a reflection of efforts by U.S. shale producers to reduce cash burn, said ANZ Research in a note.
However, despite the gradual decline in U.S. oil production, U.S. crude-oil stockpiles still rose by 2.1 million barrels last week to 504.1 million barrels, a fresh weekly record high. In monthly data, which don’t line up exactly with weekly data, inventories last exceeded 500 million barrels in 1930.
Scratch that. Markets are heaving up and down due to analysts severely misunderstanding refinery economics.
American Refinery Economics
The glut is at the refinery gate–or at least it would be, if American refineries did not stubbornly refuse to markedly increase their crude oil stocks on hand. Refinery conservatism has bedeviled even the great data-oriented mind of oil analyst Daniel Jones:
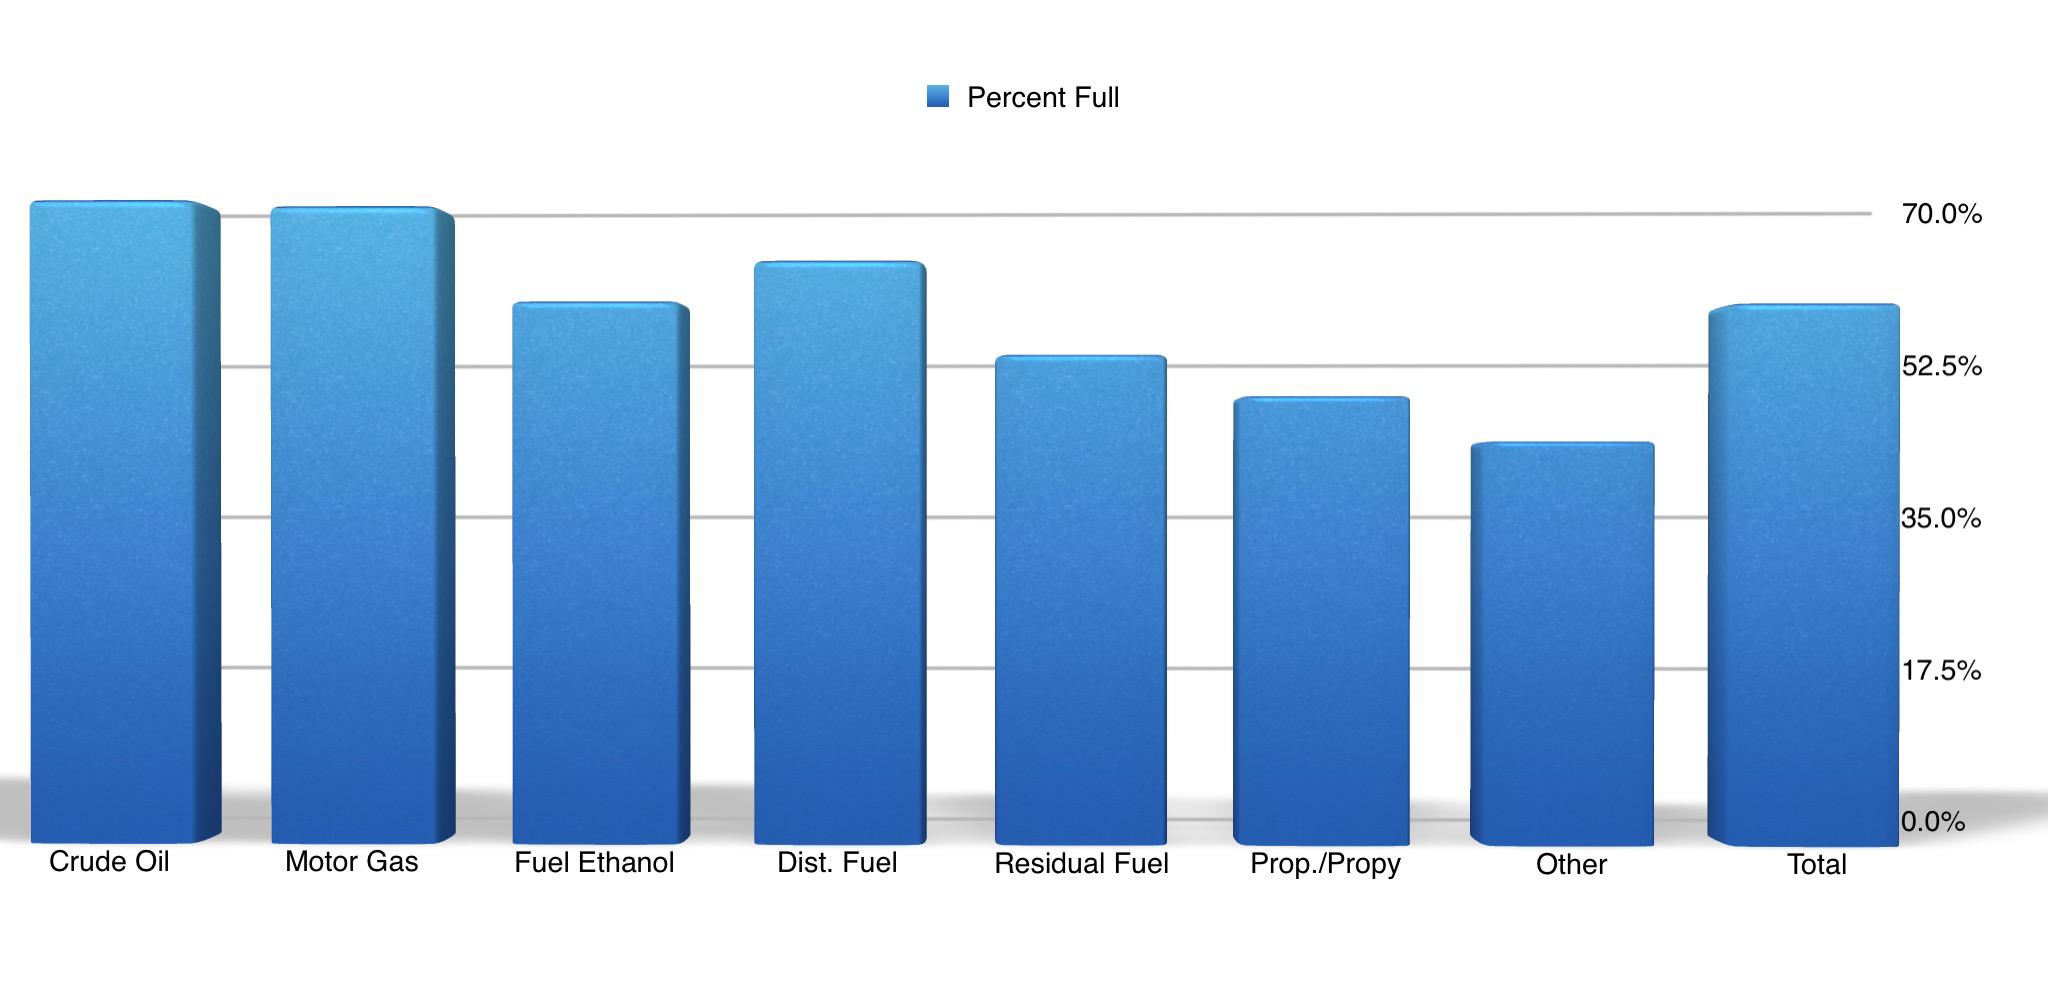
While storage at Cushing is extremely high and needs to drop down at some point in the future, the overall oil storage situation in the U.S. is far from bad. In the graph below, you can see just how full different categories of petroleum products are according to the EIA right now. As a note, the crude number factors out 120 million barrels of oil from the inventory levels because they are in transit, mostly via pipeline. My approach is the same one the EIA uses in its analysis.
What we see from all of this is that we aren’t really anywhere near storage capacity across the U.S. Yes, crude levels are at about 69.3% storage capacity but that’s a far cry from 100%. Motor gasoline is at 68.6% capacity and total crude plus petroleum products stands even lower, with storage tanks just 58% full. Although tanks in Cushing may fill up, there are plenty of places to store crude for the meantime and it’s highly unlikely that the supply/demand imbalance will last long enough to fill tanks up across the U.S.
Missing from this and all other analysis (except indirectly in the post we wrote here) is the fact that refineries have steadily reduced their petroleum product stock on hand from 353,198,000 barrels at the peak in June 1998 to 252,307,000 barrels on hand in November 2015 (the EIA will release the December figures on 29 February 2016).
The 1998 peak coincided with three straight months (June, July and August) of over 99% refinery capacity utilization, the highest operational rate ever recorded by the EIA. During the same period the gasoline wholesale price went into free-fall from its $0.579 1998 peak in May to $0.506 in August before recovering slightly on account of refinery utilization crashing from 99.9% in August to 89.6% in October. When utilization had recovered to 95.1% in December 1998 (the second highest December rate ever recorded), wholesale gasoline hit $0.426, the lowest price recorded since the EIA began tracking gasoline prices in January 1983. Most other petroleum product wholesale prices bottomed out two months later in February 1999, when utilization had dropped back to 90.0%. In effect, the markets reward breakneck refinery operations with an income reduction from a pittance to pauper status.
As a consequence of the 1998 rout, American oil refiners understandably never overproduce petroleum products, and since 2005 have been loathe to collectively operate above 95% capacity utilization. Perhaps for the same reason refiners have not permitted the crude oil glut to flood their refineries’ crude storage tanks either, which leads to yet another grave misunderstanding on Mr. Jones’ part:
Now, it should be mentioned that this doesn’t mean WTI prices won’t drop if tanks reach their peak sometime soon. Back in 2011, when tanks nearly peaked, the price of WTI fell in relation to the price of Brent, with the spread between the two climbing significantly and staying that way for years. However, in June of 2012, in response to this arbitrage opportunity, the Seaway Pipeline elected to reverse the flow of crude toward the Gulf region so that it could benefit from this disparity. Given the large pipeline network that exists today within the U.S., it wouldn’t be unthinkable for operators to also reverse flow, which would help to alleviate these concerns.
No, the reversal was purely over refinery economics. Cushing is located in PADD 2…
…and the crude pipeline system primarily connects PADD 3 (the largest refining and crude producing sector) to PADD 2 (second largest on both counts) and PADD 2 and 4 to Haristy (the WCS terminal in Alberta):
From its commissioning in 1976 Seaway ran crude from Freeport, TX to Cushing on account of OPEC imports:
Midwest (PADD 2) Imports by PADD of Processing from OPEC Countries of Crude Oil and Petroleum Products (Thousand Barrels per Day)
1993
342
397
393
481
298
432
432
484
241
417
426
407
1994
215
285
278
328
349
330
361
272
345
360
350
367
1995
265
302
362
336
381
396
308
297
350
361
399
190
1996
264
356
363
369
484
484
512
595
386
361
244
300
1997
388
472
490
381
421
461
466
423
460
617
350
291
1998
334
451
385
447
416
438
548
494
468
533
499
544
1999
404
711
618
567
612
554
523
532
485
499
406
348
2000
374
328
463
510
535
607
575
560
604
413
420
449
2001
321
420
552
587
517
469
453
513
540
380
367
373
2002
452
187
488
361
326
412
333
434
430
307
339
307
2003
319
327
428
353
437
413
306
256
453
351
261
275
2004
331
354
400
455
399
340
400
482
362
280
378
286
2005
338
372
331
346
317
268
316
258
309
471
257
293
2006
273
287
259
251
343
324
308
396
341
292
214
311
2007
258
433
534
409
375
353
346
352
402
210
259
222
2008
350
246
268
381
360
313
206
356
250
261
319
252
2009
224
205
126
126
149
138
166
173
168
126
111
143
2010
153
176
98
131
123
171
212
245
228
165
86
156
2011
123
55
153
100
95
86
68
51
50
32
64
48
2012
57
35
72
51
70
37
31
15
40
51
29
26
2013
33
14
18
32
38
39
26
139
36
38
35
38
2014
50
44
32
44
38
30
27
26
20
30
32
32
2015
32
31
31
32
45
44
58
31
50
10
17
Suddenly the choice to reverse Seaway seems less about arbitrage and more about simple usefulness. Seaway is a crude oil pipeline. PADD 3 to PADD 1 transfers are overwhelmingly petroleum products, and pipeline transfers to PADD 5 are exclusively refined fuels. PADD 4 imports since 2009 have been almost exclusively Canadian.
OPEC imports to PADD 2 had dropped 90% by June 2012; compare this with Canada where PADD 2 imports doubled between February 1993 and the Seaway reversal. Canadian imports to PADD 2 averaged 2,232,000 barrels a day last November against 17,000 bpd from Saudi Arabia (Midwestern refiners only purchase WCS, WTI, and Saudi crude), which might explain the decision to twin Seaway:
The opening up in December last year (2014) of the Enterprise/Enbridge joint venture 450 Mb/d Seaway Twin pipeline from Cushing to Freeport, TX in conjunction with the Enbridge 585 Mb/d Flanagan South line from Pontiac, IL to Cushing has enabled significant pipeline flows of heavy Canadian crude to reach the Texas Gulf Coast. According to our friends at Genscape, average daily flows on Flanagan South since December 19, 2014 have been 389 Mb/d and average flows on the Seaway Twin have been 240 Mb/d. As we described last year the two new pipelines are part of an extensive expansion project by Enbridge of their Western Gulf Access system, that delivers Western Canadian heavy oil sands crude as well as Canadian conventional crude and shale crude from the northern portions of the Williston Basin into the U.S. Midwest (see ”The Promised Land? Flanagan South and the Seaway Twin”).
The map in Figure #1 shows the path of the Enbridge Mainline from Edmonton and Hardisty in Alberta to the Chicago area (purple dashed bracket) – with two sections known as the Enbridge system on the Canadian side (light blue line) and the Lakehead System on the U.S. side (darker blue line). The new Flanagan South pipeline runs parallel to the existing 193 Mb/d Spearhead pipeline between Flanagan and Cushing (green dashed bracket). The final Seaway Twin segment from Cushing to Houston (orange bracket) runs parallel to the existing Seaway pipeline that was reversed in June 2012 and expanded to 400 Mb/d in 2014 (see Seaway Reversal). Until the Seaway reversal in 2012 there was no pipeline capacity from the Midwest to the Gulf Coast at that time except for the 98 Mb/d ExxonMobil Pegasus pipeline (itself closed for most of 2013 and 2014 by a rupture). Although the original Seaway pipeline expanded to 400 Mb/d in 2014 and the southern section of the TransCanada Keystone XL TX opened up 700 Mb/d of capacity between Cushing and Nederland, TX in the same year, flows of crude from Canada along those routes to the Gulf Coast were still constrained by a lack of Canadian crude flowing into Cushing. The heavy crude that did flow from Canada into the Midwest (via Spearhead and the original Keystone pipeline) was primarily destined for regional refineries – many of which – like the 400 Mb/d BP Whiting refinery in Illinois had been specifically upgraded to process heavy Canadian crude.
Where exactly, Mr. Jones, are there any existing pipelines that can be reversed to drain Cushing and meaningfully add to the 1,000,000+ bpd flow that is already available (but PADD 3 refineries decline to use to full effect)? Seaway has become part of the Enbridge system–an attempt by one Canadian oil company to cut into the dominance of TransCanada’s Keystone system, whose Phase IIIa has 55% more discharge capacity than the single Seaway pipeline and ends in Port Arthur, the location of the largest American oil refinery.
This does raise one question–why are American oil refineries increasingly turning to Canadian oil and oil companies over domestic and seaborne foreign crude oil sources?
The Value in Heavy/Low Prices Rule
Heavy oil has far more impurities in it, which makes it more costly to refine, and the mining and in situ processes to extract the bitumen from the Athabasca oil sands in Alberta is also more expensive than conventional drilling. More expensive to extract and refine, yet diluted bitumen and upgraded bitumen represented 62.9% of January 2016 Canadian crude oil output; 2,436,000 barrels per day out of a total of 3,875,000 bpd. How and why would American oil refineries demand 3.4 million barrels of Canadian crude every day? Canadian oil sands companies think they have the answer…
Alberta’s long-awaited and much over-hyped Royalties Framework Report makes the case that the United States, once our biggest customer, is now our biggest competitor in world oil markets. This isn’t entirely correct. Although the US has substantially ramped up shale oil production in the past 8 years, much of that oil is far too light for its own refineries. And that’s creating a serious imbalance in North America’s energy markets. Now that the US has lifted its oil export ban, much of that shale oil will end up in Europe, whose refineries are better suited for light sweet crude feedstock. And that means US demand for heavy oil won’t be subsiding anytime soon.
…likely believing that the WTI glut in Cushing indicates American refineries hate light sweet crude which has far fewer impurities to squeeze out–i.e., cheaper to refine. Albertan oil companies clearly are unaware that American refineries had increased domestic crude inputs by 55% from 2009 to 2015, and the fact that weekly exports remain unchanged in 2016 indicates they do not understand why American refiners find bitumen so appealing. Here’s the real reason why:
[…] both increased capacity draws year-over-year after the 2016 explosion and the assertion of the 95% rule in April 2017, lest there be a rerun of the 1998 summer and fall […]


[…] both increased capacity draws year-over-year after the 2016 explosion and the assertion of the 95% rule in April 2017, lest there be a rerun of the 1998 summer and fall […]
LikeLike